This review was originally published for the American Academy of Sports Physical Therapy's (AASPT) Sports Performance Enhancement Special Interest Group research review. For more details go to https://www.aaspt.org/spe-sig
Introduction, History, and Controversy:
Since the first public appearance in 2016 as a prototype, the Nike Zoom Vaporfly 4% (as well as its successors the ZoomX Vaporfly Next% and Air Zoom Alphafly Next%) has been worn by runners during recent world records in the marathon, half-marathon, and 15-km races.[1] The original design of the shoe was unique at its inception, as it marked a significant departure from the minimalist-style racing shoe prominent at the time. Other brands have since released their version of the high performance running shoe, but nearly all share common features: a large (~40 mm) stack height, a carbon fiber plate embedded in the midsole, and a highly compliant and lightweight foam. The combination results in an efficient, cushioned racing flat (reported to weigh between 184-205 g for a men’s US size 10).[2,3]
The introduction of this new generation of high performance footwear has taken the running world by storm, sparking a myriad of questions, concerns, and controversies. At the Ineos 1:59 challenge in 2019, Eliud Kipchoge notably wore a prototype of the future Nike Air Zoom Alphafly Next% as he became the first athlete to break the two hour marathon (unofficially, due to regulations). Two months later, a New York Times analysis of Strava and public race data showed a 4-5% improvement in performance for Nike Vaporfly 4%/Next% users compared to average running shoe users, as well as a 2-3% improvement against the next-fastest popular shoe.[4] World Athletics, the international governing body of athletics, made a ruling in January of 2020 banning any shoe with a stack height > 40 mm (or > 30 mm with spikes), a double carbon fiber plate, or that had not been commercially available for more than four months. This ruling was amended in July of 2020, banning any shoe with a stack height > 25 mm for track and field or cross-country competition.
Despite its growing popularity in the competitive running scene, there is a paucity of literature on high performance footwear. To date (September 2020), there are only four published studies and one preprint investigating the biomechanical and/or physiological effects of the Nike Zoom Vaporfly 4% or its prototype version.[2,3,5-7] The purpose of this review is to highlight 1) what has been established in the laboratory setting and 2) the largest limitations in the high performance footwear literature.
A list of all shoes investigated in this review can be found in Table 1.
Table 1
Laboratory Studies:
The first two publicly available studies on the Nike Vaporfly prototype were funded by Nike and conducted by Hoogkamer et al.[5,6] In the first study, 18 elite male runners took part in four sessions of submaximal running tests with four different shoe conditions: the Nike prototype (NP), Nike Zoom Streak 6 (NS), Adidas Adizero Adios Boost 2 (AB), and their own shoes.[5] A men’s US size 10 shoe was worn across all conditions and lead pellets were added to the NP and NS to standardize the weight between the three test shoes. Energetic cost, peak vertical ground reaction force, step frequency and contact time were the variables of interest during treadmill testing. In the first session, participants ran in their own shoes for five-minute trials at 14, 16, and 18 km/h with a five-minute rest period between intervals. The 18 runners that qualified for the analysis were below the onset of blood lactate accumulation (4 mmol/L) during each running condition. During each subsequent visit, the participants completed six five-minute trials at one of the three speeds, randomly assigned, with a five-minute break between intervals. Each shoe condition (NP, NS, AB) was worn twice in a randomized mirrored order and all metrics were the average of both trials. Rate of metabolic energy consumption was calculated over the last two minutes of each interval. VO2max testing was performed at the end of the last visit. Following run testing, a mechanical testing protocol was performed on each of the three test shoes. The mechanical testing showed that the NP deformed 11.9 mm, nearly twice as compliant as the NS and AB at 6.1 mm and 5.9 mm, respectively. The NP also demonstrated an 87.0% energy return, more resilient than the AB and NS at 75.9% and 65.5%, respectively. Across the three running speeds tested, the NP showed a lower energetic cost of running (measured in W/kg) by 4.16% compared to the NS and 4.01% compared to the AB. All 18 participants saw a decrease in the energetic cost of running in the NP at each of the three speeds. Values ranged from -1.59% to -6.26% compared to the NS and -1.97% and -6.08% compared to the AB. Minor differences in gross biomechanics were shown, which did not fully explain the energy savings.
In the second study by Hoogkamer et al., 10 elite male runners (including six participants from the prior study) participated in one session of submaximal running under three different shoe conditions: the NP, NS, and AB. Shoe weight was standardized as per the first study. Participants ran five-minute trials at 16 km/h with each of the three shoe conditions and a five-minute break between intervals. Ground reaction force (GRF) and kinematic data was collected during the last 30 seconds of each trial, with 10 strides analyzed. Joint angle, angular velocity, moment, power, and work during stance phase was calculated for the hip, knee, ankle, and MTP joints. Mechanical energy storage and return was estimated based on peak vertical GRF and the known resiliency of the test shoes. The NP showed a lower step frequency than the NS and AB conditions, which at a fixed speed meant that step length was 1.7% greater. Peak vertical GRF was also larger in the NP on average compared to the NS and AB trials by 2% and 1.7%, respectively. No kinematic or kinetic differences between conditions were seen at the hip and knee. Peak ankle joint moment, peak ankle dorsiflexion angle, negative ankle work, and positive ankle work were all lower in the NP condition. Negative MTP work in the NP was 35% less than the AB and 52% less than the NS, but there were no significant differences between positive MTP work. Mechanical compression energy storage per step was greater in the NP by 77% and 88% compared to the NS and AB, respectively. Energy return estimates were also higher in the NP than the NS and AB at 0.109, 0.046, and 0.051 J/kg/step, respectively. Mechanical bending energy storage and return was also greatest in the NP, but much smaller in value than compression energy (.0142 and .0025 J/kg/step, respectively).
In 2019, Barnes and Kilding [2] published a novel study comparing the Nike Vaporfly (NVF) to other shoe conditions in a group of twenty-four (12 male and 12 female) highly trained runners (defined as having run a 5- and/or 10-km race under 15 or 30 min (men), respectively, or under 17:15 or 35:30 min (women). This study intended to explore changes in running economy between shoe conditions, and also explore the “confounding effects of shoe mass on the energetic costs of running”.[2] Interestingly, this study was the first to explore differences between the NVF and a track spike, which was one of the shoe conditions.
Each participant completed 3 testing sessions (with at least 72 hours between testing sessions) in which the rate of Oxygen uptake (VO2), biomechanical stride characteristics, and blood lactate concentrations were collected. These variables were collected during various speeds of running (14, 16, and 18 km·h−1 for men, and 14, 15, and 16 km·h−1 for women) under each of the four shoe conditions. Session 1 served as a familiarization session, while session 2 and session 3 involved data collection. Sessions 2 and 3 both involved 4x 5-minute trials at each speed, with each shoe condition. However, session 3 also incorporated an additional maximal aerobic power (VO2peak) test in their own shoes after all other trials were completed. Variables explored were defined as the following: blood lactate - finger prick blood sample collected within 1 minute of each trial; biomechanics measures - stride rate, stride length, contact time, and flight time; aerobic capacity - running economy (VO2): ml·kg−1·min−1, gross oxygen cost of transport (O2COT): ml·kg−1·km−1, and energetic cost: W·kg−1.
“The NVF shoe improved running economy by 4.2 ± 1.2%, on average, across all running speeds compared with ADI, and 2.6 ± 1.3% compared with NZM”[2]. Even when mass was matched (NVF+), the NVF+ still performed 2.9+/-1.3% more efficient than the ADI irrespective of the speed (Figure 1).
Figure 1
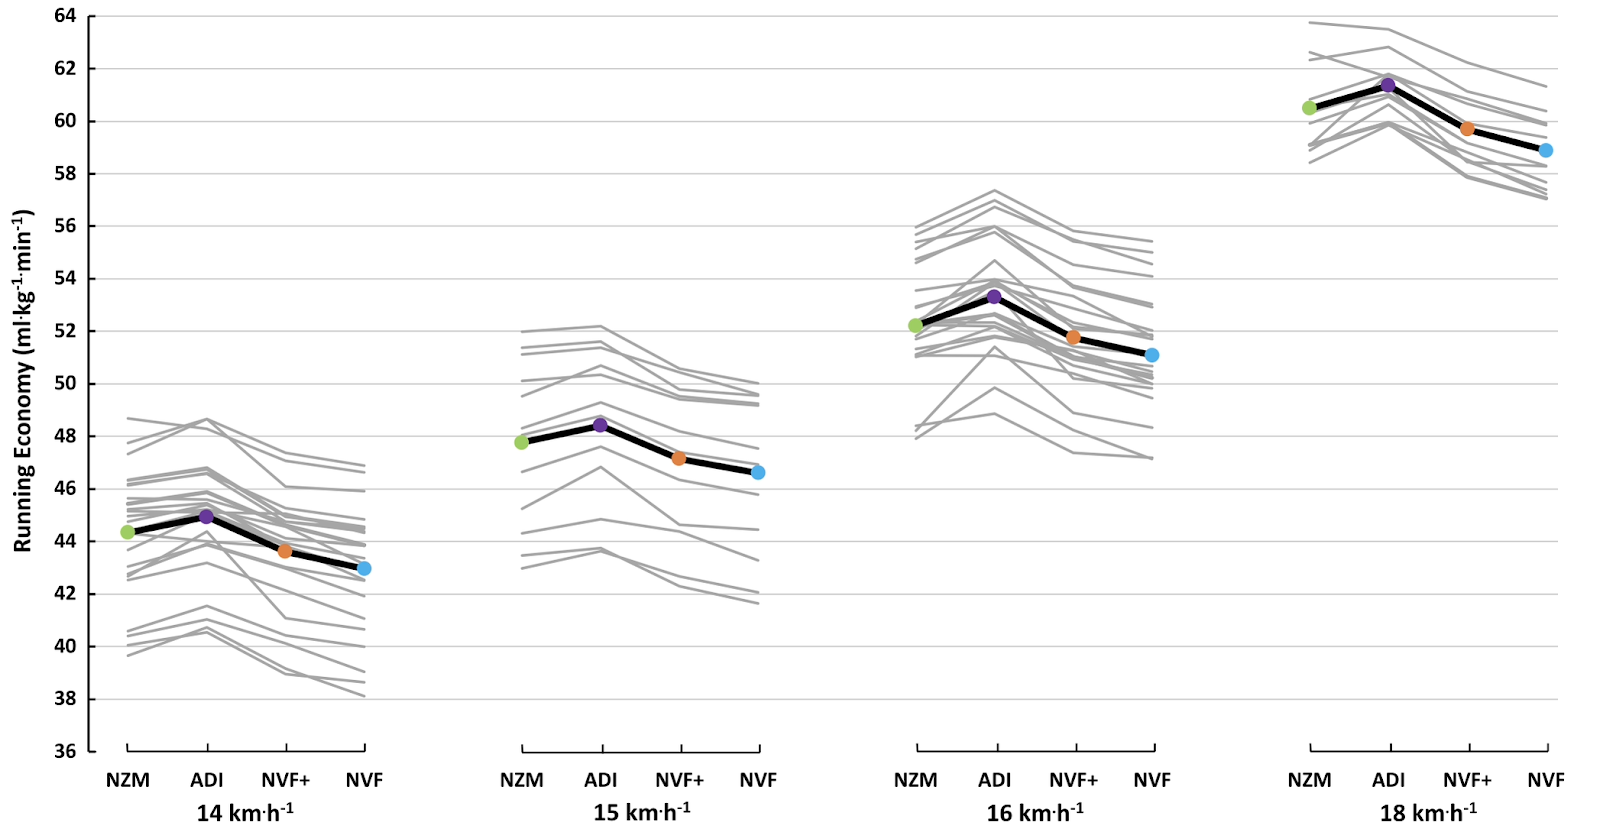
All tested subjects demonstrated better efficiency in the NVF when compared to the ADI (range: − 1.72 to − 7.15%), and all but two subjects were more efficient in the NVF than the NZM (+ 0.50 to − 5.34%)[2]. Biomechanically, no differences were noted between the NVF and NVF+. While the study found some differences in the biomechanical variables, these were largely inconsistent and were proposed to be impacted by the treadmill compliance and traction on the belt. This was noted as a limitation of the study, recognizing that treadmill running does present some issue with generalizability to other running surfaces.
Reflecting on the results of this study, it presents further support for the progress in shoe material properties. It has been proposed that adding 100g per shoes has ~0.75% impact on oxygen consumption in running.[8] However, appreciating that the NVF weighed ~42% more than the NZM, yet produced an average of 2.6% improvement in VO2, this study further illuminates the impact of the properties of the shoe, rather than only the weight. This study also marked a very important finding in regards to track racing and foot wear.“Substantial differences were also observed, albeit lower in magnitude, when the NVF shoes were weight-matched to that of the ADI shoes, indicative that factors other than shoe mass are influential on running economy.” [2]
In 2019, Hunter and colleagues investigated the effects of the commercially available Nike Zoom Vaporfly 4% on running economy.[3] 19 elite male runners participated in two sessions of submaximal running under three different shoe conditions: the NVF, NS, and AB. Shoes ranging from men’s US size eight to 12 were worn across all conditions and mass was intentionally not standardized between shoes to represent the effects on consumers. Submaximal oxygen uptake (running economy), ground contact time, stride rate, peak vertical GRF, vertical impulse, vertical oscillation, knee flexion range of motion (ROM), hip flexion ROM, and plantar flexion velocity were the variables of interest during treadmill testing. In the first session, the participants completed the same treadmill protocol from Hoogkamer et al., running in each shoe twice for five minutes at 16 km/h. Oxygen uptake was averaged over the last two minutes in each interval. In the second session, the participants ran for three minutes in each shoe at 16 km/h while kinetic and kinematic data were recorded over the last 30 seconds of each trial.
Oxygen uptake was lower in the NVF condition by 2.8% compared to the AB and 1.9% compared to the NS, demonstrating improvements in running economy (measured in ml/kg/min). Individual subject values in the NVF ranged from 0% to -6.4% compared to the NS and AB. Stride length (calculated by stride rate and running speed) in the NVF was greater in the NVF compared to the AB and NS by 1.3% and 0.7%, respectively. Vertical oscillation was also larger in the NVF compared to the AB and NS by 5.3% and 4.8%, respectively. Plantar flexion velocity was lower in the NVF by 6.3% compared to the AB and 10.7% compared to the NS. No other kinetic or kinematic variables were significantly different between shoe conditions. While ground contact time was not different between shoes in this study, it was a significant predictor of running economy benefits in the NVF; runners with shorter ground contact times saw greater improvements in running economy (P=0.01).
The improvements of this new technology are not universally consistent and appear to be dependent on a myriad of confounding interpersonal variables. This was highlighted in the most recent publication, in preprint form at the moment, from Hébert-Losier et al[7]. This study investigated 18 male recreational runners (mean/standard deviation: VO2peak = 55.8/4.4 ml·kg-1·min-1, and recent 5-km time 21:18.61/ 1:58.22) in a randomized crossover study. The intention of this study was to explore the effects of 2 types of shoe wear, specifically the Nike VaporFly 4% (NVF4%) and a lightweight racing flat shoe - Saucony Endorphin Racer 2 road (SER), against the participant’s own shoe in running economy and 3-km time trial performance. This was completed over 4 sessions, each separated by 4-7 days, and all sessions were completed in a laboratory environment with temperature and humidity controlled. The shoes were painted black as to blind the participant to the type of shoe worn, and baseline information was collected (Table 2).
Table 2
Session 1 included a maximal aerobic power test in the individual’s own shoes, which was used to determine velocity corresponding to VO2 (vVO2) at percentages of 60%,70%,80%, which was used for consistency in sessions 2-4. Sessions 2-4 explored running economy and time trial performance within each of the 3 shoe conditions, randomized for order effect. Each session included 3x 3-minute running trials at 60%,70%,and 80% of vVO2 (averages/SD: 60%: 11.0 (0.6) km·h-1], 70%: 12.9 (0.7) km·h-1, and 80%: 14.7 (0.8) km·hr-1). Blood lactate - via finger prick (less than 1 minute from completion of each bout), heart rate (taken throughout the bouts using wearable monitoring), and running economy (average of the two highest consecutive 15-second VO2 readings registered in the last minute of each bout) were collected for each session. Finally, for the time trial, subjects were blinded to elapsed time and speed during all trials, and were given standard measurements of distance remaining with no further cueing or encouragement. They were allowed to adjust the speed throughout the trial, and each participant was asked to rate their perceived shoe comfort using VAS.
Table 3 corresponds to the reported results with corresponding magnitude of difference inferences specific to the running economy variables. The researchers found no effect of shoe mass on running economy. However, running economy was found to be statistically different in both the NVF4% (p < .002) and SER (p < .042), when compared to the participants own shoe at the vVO2 of 60,70,80% - average percentage improvements for the NVF4% were 4.4, 4.5, and 3.6 % and the SER were 4.0, 3.0, and 2.4% respectively. Although these were significant findings, the magnitude of these differences was interpreted as “small” (based on Cohen’s d). When the NVF4% was compared to the SER, “trivial” differences in running economy were noted. Interestingly, individual runner’s running economy “across all intensities ranged from -8.6 to 13.3% in NVF4% compared to their own shoes, -9.6-9.7% in NVF4% compared to the SER, and -5.5 to 14.2% in SER compared to their own shoes, where a positive percent change indicates improved running economy”[7]. “Of the 17 runners with complete dataset; 8 (47%) were most economical in NIKE, 2 (12%) in FLAT, and 7 (41%) demonstrated inconsistency across intensities.”[7] This highlights the proposal that the impacts of this type of shoe wear may be user dependent and very much individualized according to foot strike pattern, prior running capacity, and previous experience in various models of shoe wear.
Table 3: Comparison of all physiological, perceptual, and performance variables from the running economy test (mean [95% CI] and Cohen’s d effect size [95% CI]) between footwear conditions from 18 male runners†
In regards to the time trial arm of the study, this also found no significant effect of shoe mass on performance. However, as seen in the physiologic aspects in the velocity arm of the study, significant impacts (p = .005) were found with shoe conditions in the time trial. Average speed for the time trials: NVF4% = 16.3 (1.3) km·h-1 in NVF4%, 16.0 (1.3) km·h-1 in the SER, and 15.9 (1.3) km·h- 1 in their own shoes (Table 3). 11 (61%), of the total 18 runners, produced their fastest performances in the NVF4%, 4 (22%) in the SER, and 3(17%) in their own shoes.
Table 4: Comparison of all physiological, perceptual, and performance variables from the 3-km time trial (mean (SD) and Cohen’s d effect size [95% CI]) between footwear conditions from 18 male runners†
This study offers extremely interesting insight into the nuance and variability within individuals in this new type of shoe technology. The impacts are not overwhelmingly predictable, and therefore it is likely underlying variables and criteria exist that mark a person as a responder to the NVF4% compared to others. Reviewing all runners’ data, only 5 (29%) produced both their best running economy and best time trial in the NVF4%, while the remaining runners produced their best running economy and time trial in different shoes, irrespective of foot strike pattern (although this question of foot strike did not contain a substantial number of participants by which to make this interpretation). While the NVF4% has a significant impact on running economy and time trial performance, the size of this impact remains inconsistent.
A summary of the study characteristics is presented in Table 4.
Table 4
Limitations, Costs, and Unknowns:
While there is clear evidence in support of using high performance footwear such as the NVF to improve running economy and performance, the literature is not without limitations. The most apparent issue is that all of the currently available data on this type of shoe has been drawn from 53 elite males, 12 elite females, and 18 recreational males. The effects of running in the high performance running shoe are virtually unknown in other large running populations such as recreational females, masters runners, and adolescent runners. It is also important to note that all of the laboratory studies tested either the Nike Zoom Vaporfly 4% or its prototype; there is no publicly available data on any other models or brands, most of which are the models that several current male and female world records have been broken in (such as the Next% and Alphafly).
In addition to the limited body of literature, the laboratory studies have some clear limitations in their direct applicability. While a recent systematic review concluded that motorized treadmill running biomechanics are largely similar to running overground, there are differences in air resistance at high running speeds.[9] Given that all of the laboratory studies tested participants on treadmills, it is unknown whether air resistance proportionately affects running economy in high performance footwear versus other footwear. Treadmill protocols between most studies were similar, testing shoes in three to five minute intervals (save for Hebert-Losier et al. which included a time trial between 10-14 minutes) across multiple speeds. It is unclear if the running economy benefits of the high performance running shoe would change over the duration of a long-distance race such as the marathon. Only one study attempted to minimize the placebo effect in testing by spray painting both testing shoes black.[7] It therefore cannot be ruled out that some contribution to improved performance in testing was due to this.
The financial cost of the Nike Vaporfly models and other high performance footwear may be a barrier for many runners. Popular models range from $225-275 USD. By contrast, the Nike Zoom Streak 6 and Adidas Adios Boost 2 were $110 and $140 USD on release, respectively. Although World Athletics amended their ruling to ensure shoes were commercially available for elite runners, the average competitive recreational runner may have a more difficult time accessing these shoes due to a high surge in demand in recent years. It is also pertinent to comment on the unknown and potentially negative effects of the introduction of high performance footwear. The literature on minimalist footwear has shown limited evidence for increases in foot muscle size after 10-26 weeks of training, thought to be a result of the foot adapting to an increased loading demand.[10] It is currently unknown if the long-term usage of a shoe that reduces torque and range of motion demands at the ankle and 1st MTP may lead to de-adaptations and if this may affect injury risk for specific types of running-related injuries. It is also worth discussing the somewhat counterintuitive downstream effect of introducing a high performance running shoe that improves running economy. Running performance and running injuries represent a complex system, where a change in one parameter may indirectly influence another.[11] If a runner transitions into a new shoe that allows them to train more than they did previously at an equivalent energy cost, this change in training load may become a new risk factor for sustaining a running-related injury. Conversely, it is possible that the runner could reach a higher level of performance as a result of new training adaptations.
Indications for Running Performance Enhancement:
As with all decisions related to performance enhancement, an individualized cost-benefit analysis should take place. Based on the available evidence, high performance footwear seem to be effective at improving running economy in elite male runners competing in races at the 10-km distance and above. If the financial cost is not a barrier and the athlete is comfortable wearing high-stack cushioned running shoes, the benefits of racing in this type of shoe likely outweigh the costs from a performance perspective. However, as the utilization of this type of shoes grows, it is truly unknown what unintended secondary and tertiary biomechanical impacts may follow with persistent, long term use.
References:
Burns GT, Tam N. Is it the shoes? A simple proposal for regulating footwear in road running. Br J Sports Med. 2019; https://doi.org/10.1136/bjsports-2018-100480.
Barnes KR, Kilding AE. A randomized crossover study investigating the running economy of highly trained male and female distance runners in marathon racing shoes versus track spikes. Sports Med. 2019;49(2):331-42.
Hunter I, McLeod A, Valentine D, Low T, Ward J, Hager R. Running economy, mechanics, and marathon racing shoes. J Sports Sci. 2019;37(20):2367-73.
Quealy K, Katz J. Nikeʼs fastest shoes may give runners an even bigger advantage than we thought. The New York Times. December 13, 2019. Available: https://www.nytimes.com/interactive/2019/12/13/upshot/nike-vaporfly-next-percent-shoe-estimates.html [Accessed September 14, 2020].
Hoogkamer W, Kipp S, Frank JH, Farina EM, Luo G, Kram R. A Comparison of the Energetic Cost of Running in Marathon Racing Shoes. Sports Med. 2018;48(4):1009-1019.
Hoogkamer W, Kipp S, Kram R. The Biomechanics of Competitive Male Runners in Three Marathon Racing Shoes: A Randomized Crossover Study. Sports Med. 2019;49(1):133-143.
Hébert-Losier K, Finlayson SJ, Driller MW, Dubois B, Esculier JF, Beaven CM. Evidence of variable performance responses to the Nike 4% shoe: Definitely not a game changer for all recreational runners. SportRxiv. 2020; https://doi.org/10.31236/osf.io/ctavy
Frederick EC, Daniels JT, Hayes JW. The effect of shoe weight on the aerobic demands of running. In: Bachl N, Prokop L, Suckert R, editors. World congress of sports medicine, 1984. Vienna: Urban and Schwarzenberg; 1984. p. 616–25.
Van hooren B, Fuller JT, Buckley JD, et al. Is Motorized Treadmill Running Biomechanically Comparable to Overground Running? A Systematic Review and Meta-Analysis of Cross-Over Studies. Sports Med. 2020;50(4):785-813.
Warne JP, Gruber AH. Transitioning to Minimal Footwear: a Systematic Review of Methods and Future Clinical Recommendations. Sports Med Open. 2017;3(1):33.
Hulme A, Mclean S, Salmon PM, Thompson J, Lane BR, Nielsen RO. Computational methods to model complex systems in sports injury research: agent-based modelling (ABM) and systems dynamics (SD) modelling. Br J Sports Med. 2019;53(24):1507-1510.
No comments:
Post a Comment